SKILLS
Data Scraping /
Data Analysis /
Data Visualization / Visual Identity
How do restaurants in Chinatowns and Chinese ethnoburbs tell parallel stories about their unique communities? How might these insights be relevant to the preservation and revitalization of Chinatowns amid neighborhood change?
Edible Chinatown is a data visualization that illuminates cultural patterns through a comparative analysis of Chinatowns and Chinese ethnoburbs, a cluster of a particular ethnic minority population.
Specifically, we explored Chinatowns and Chinese in Vancouver & New York, which are home to two of the largest Chinese populations outside of Asia.


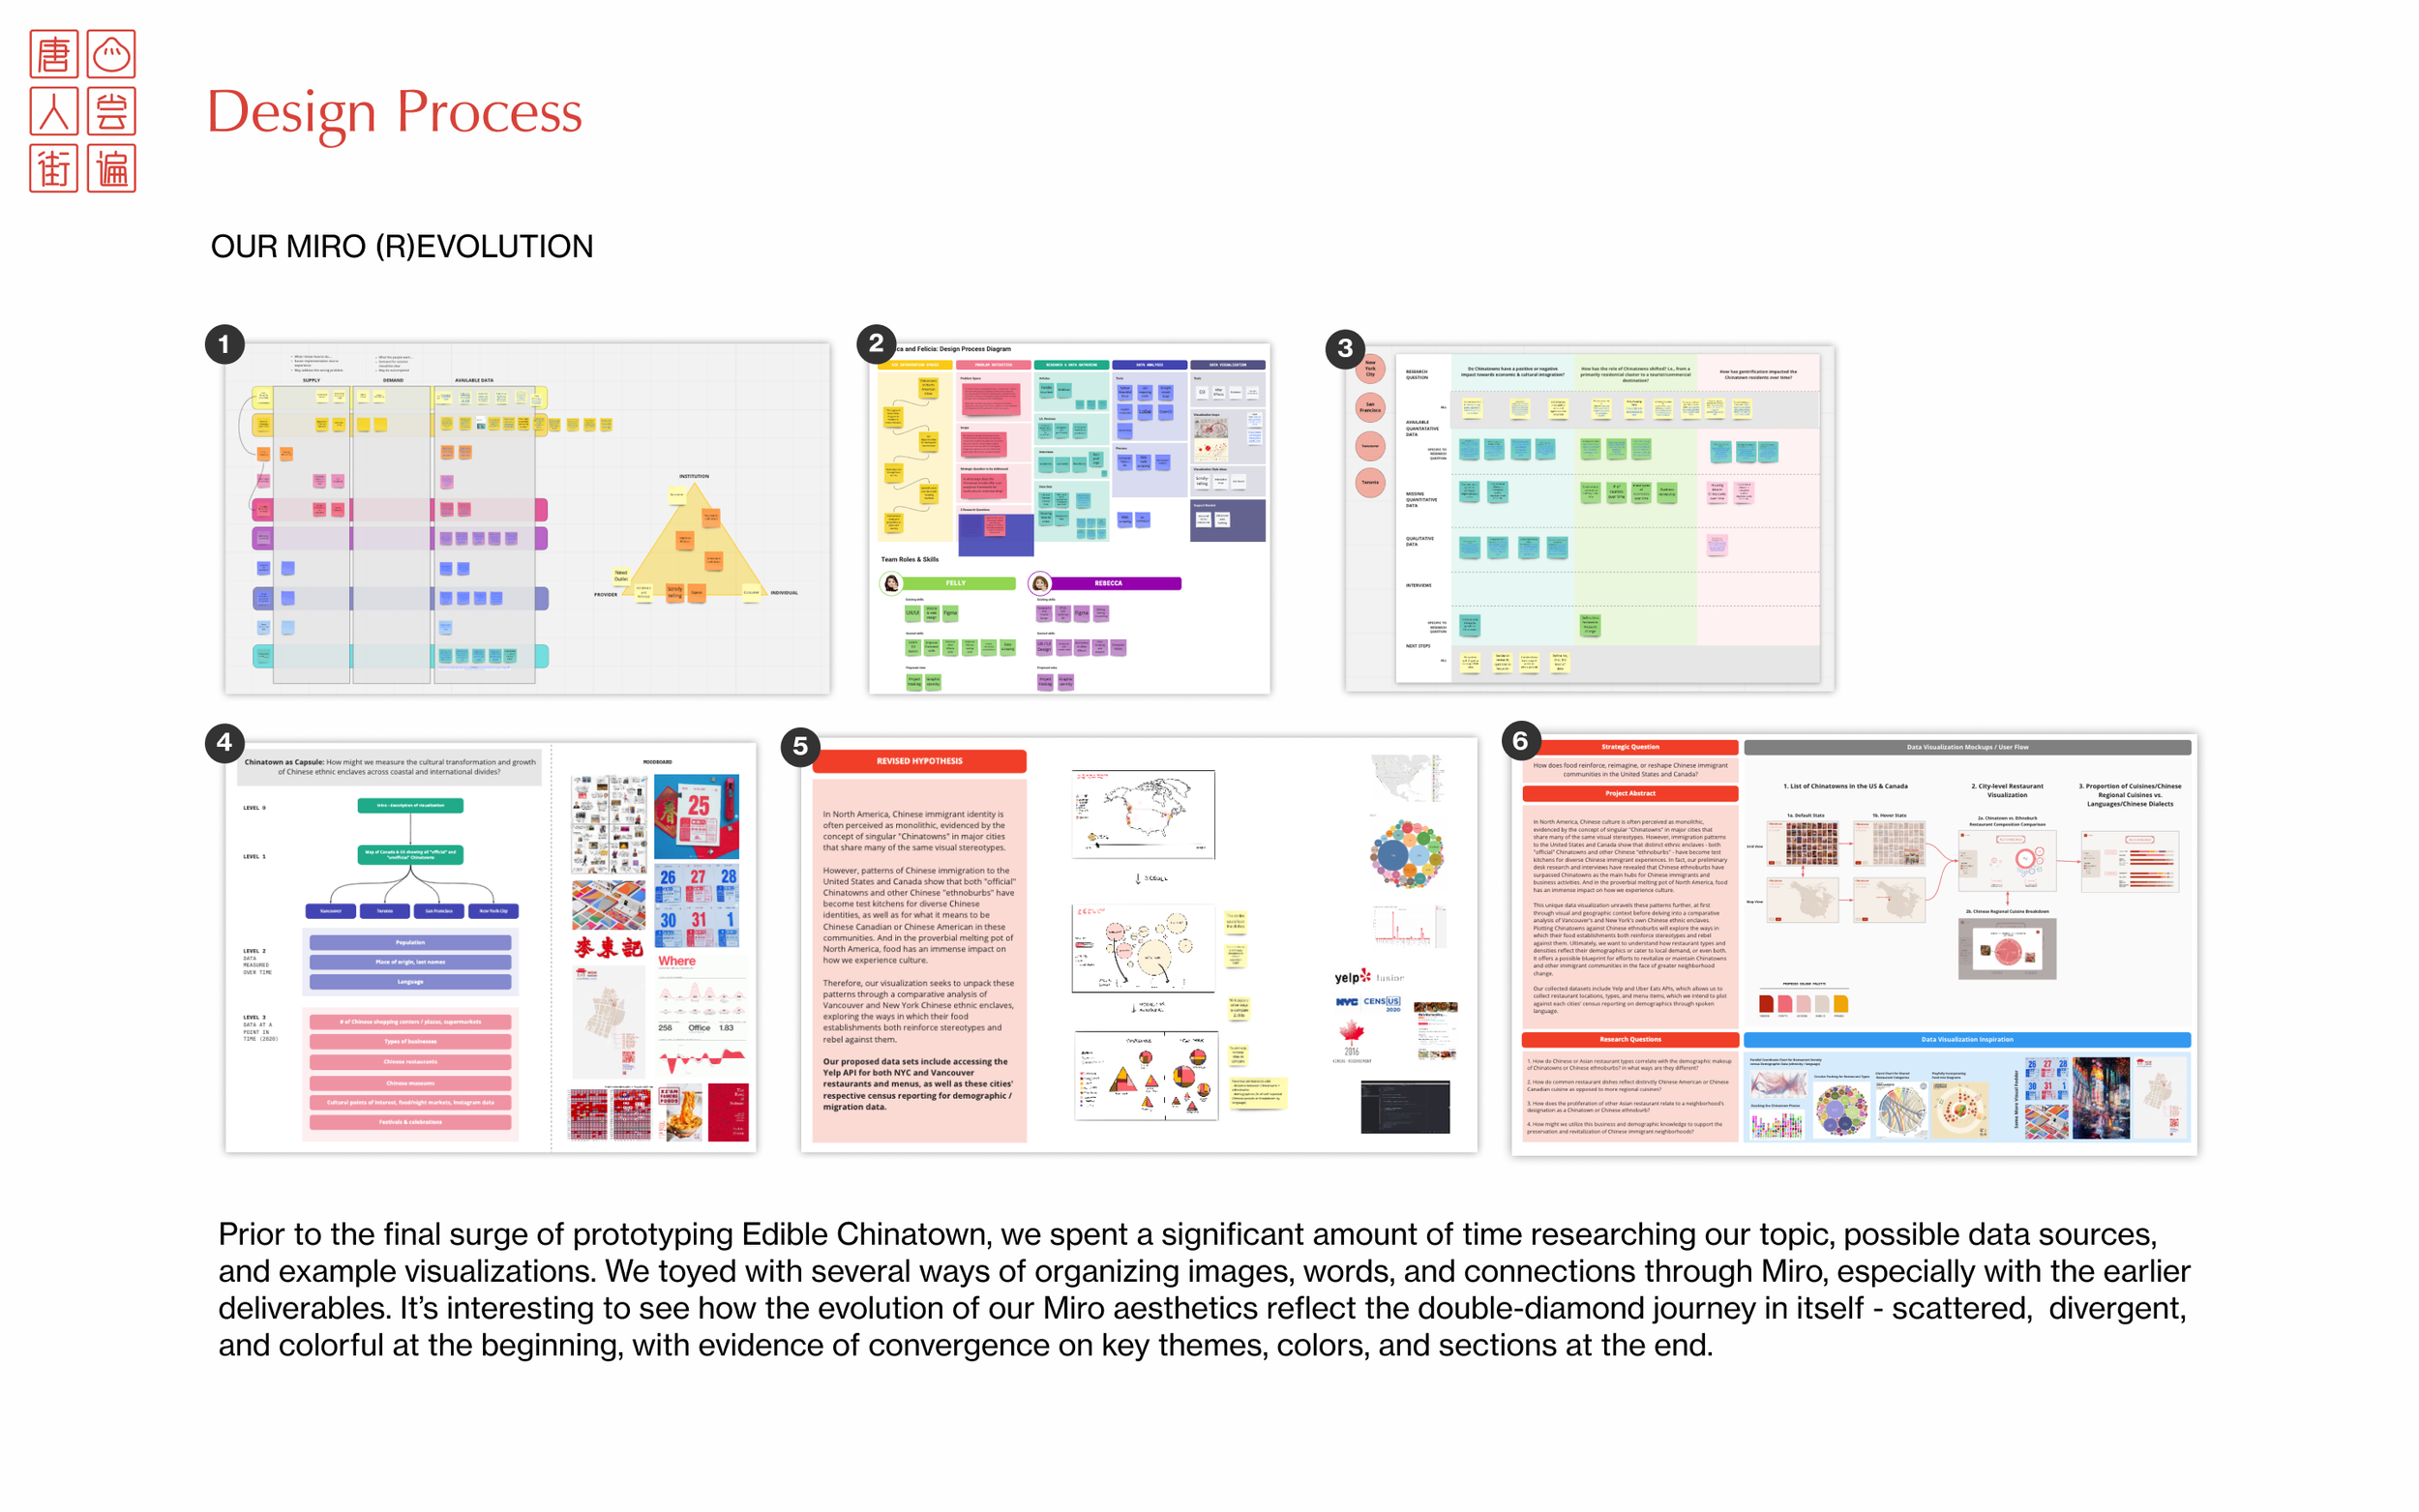
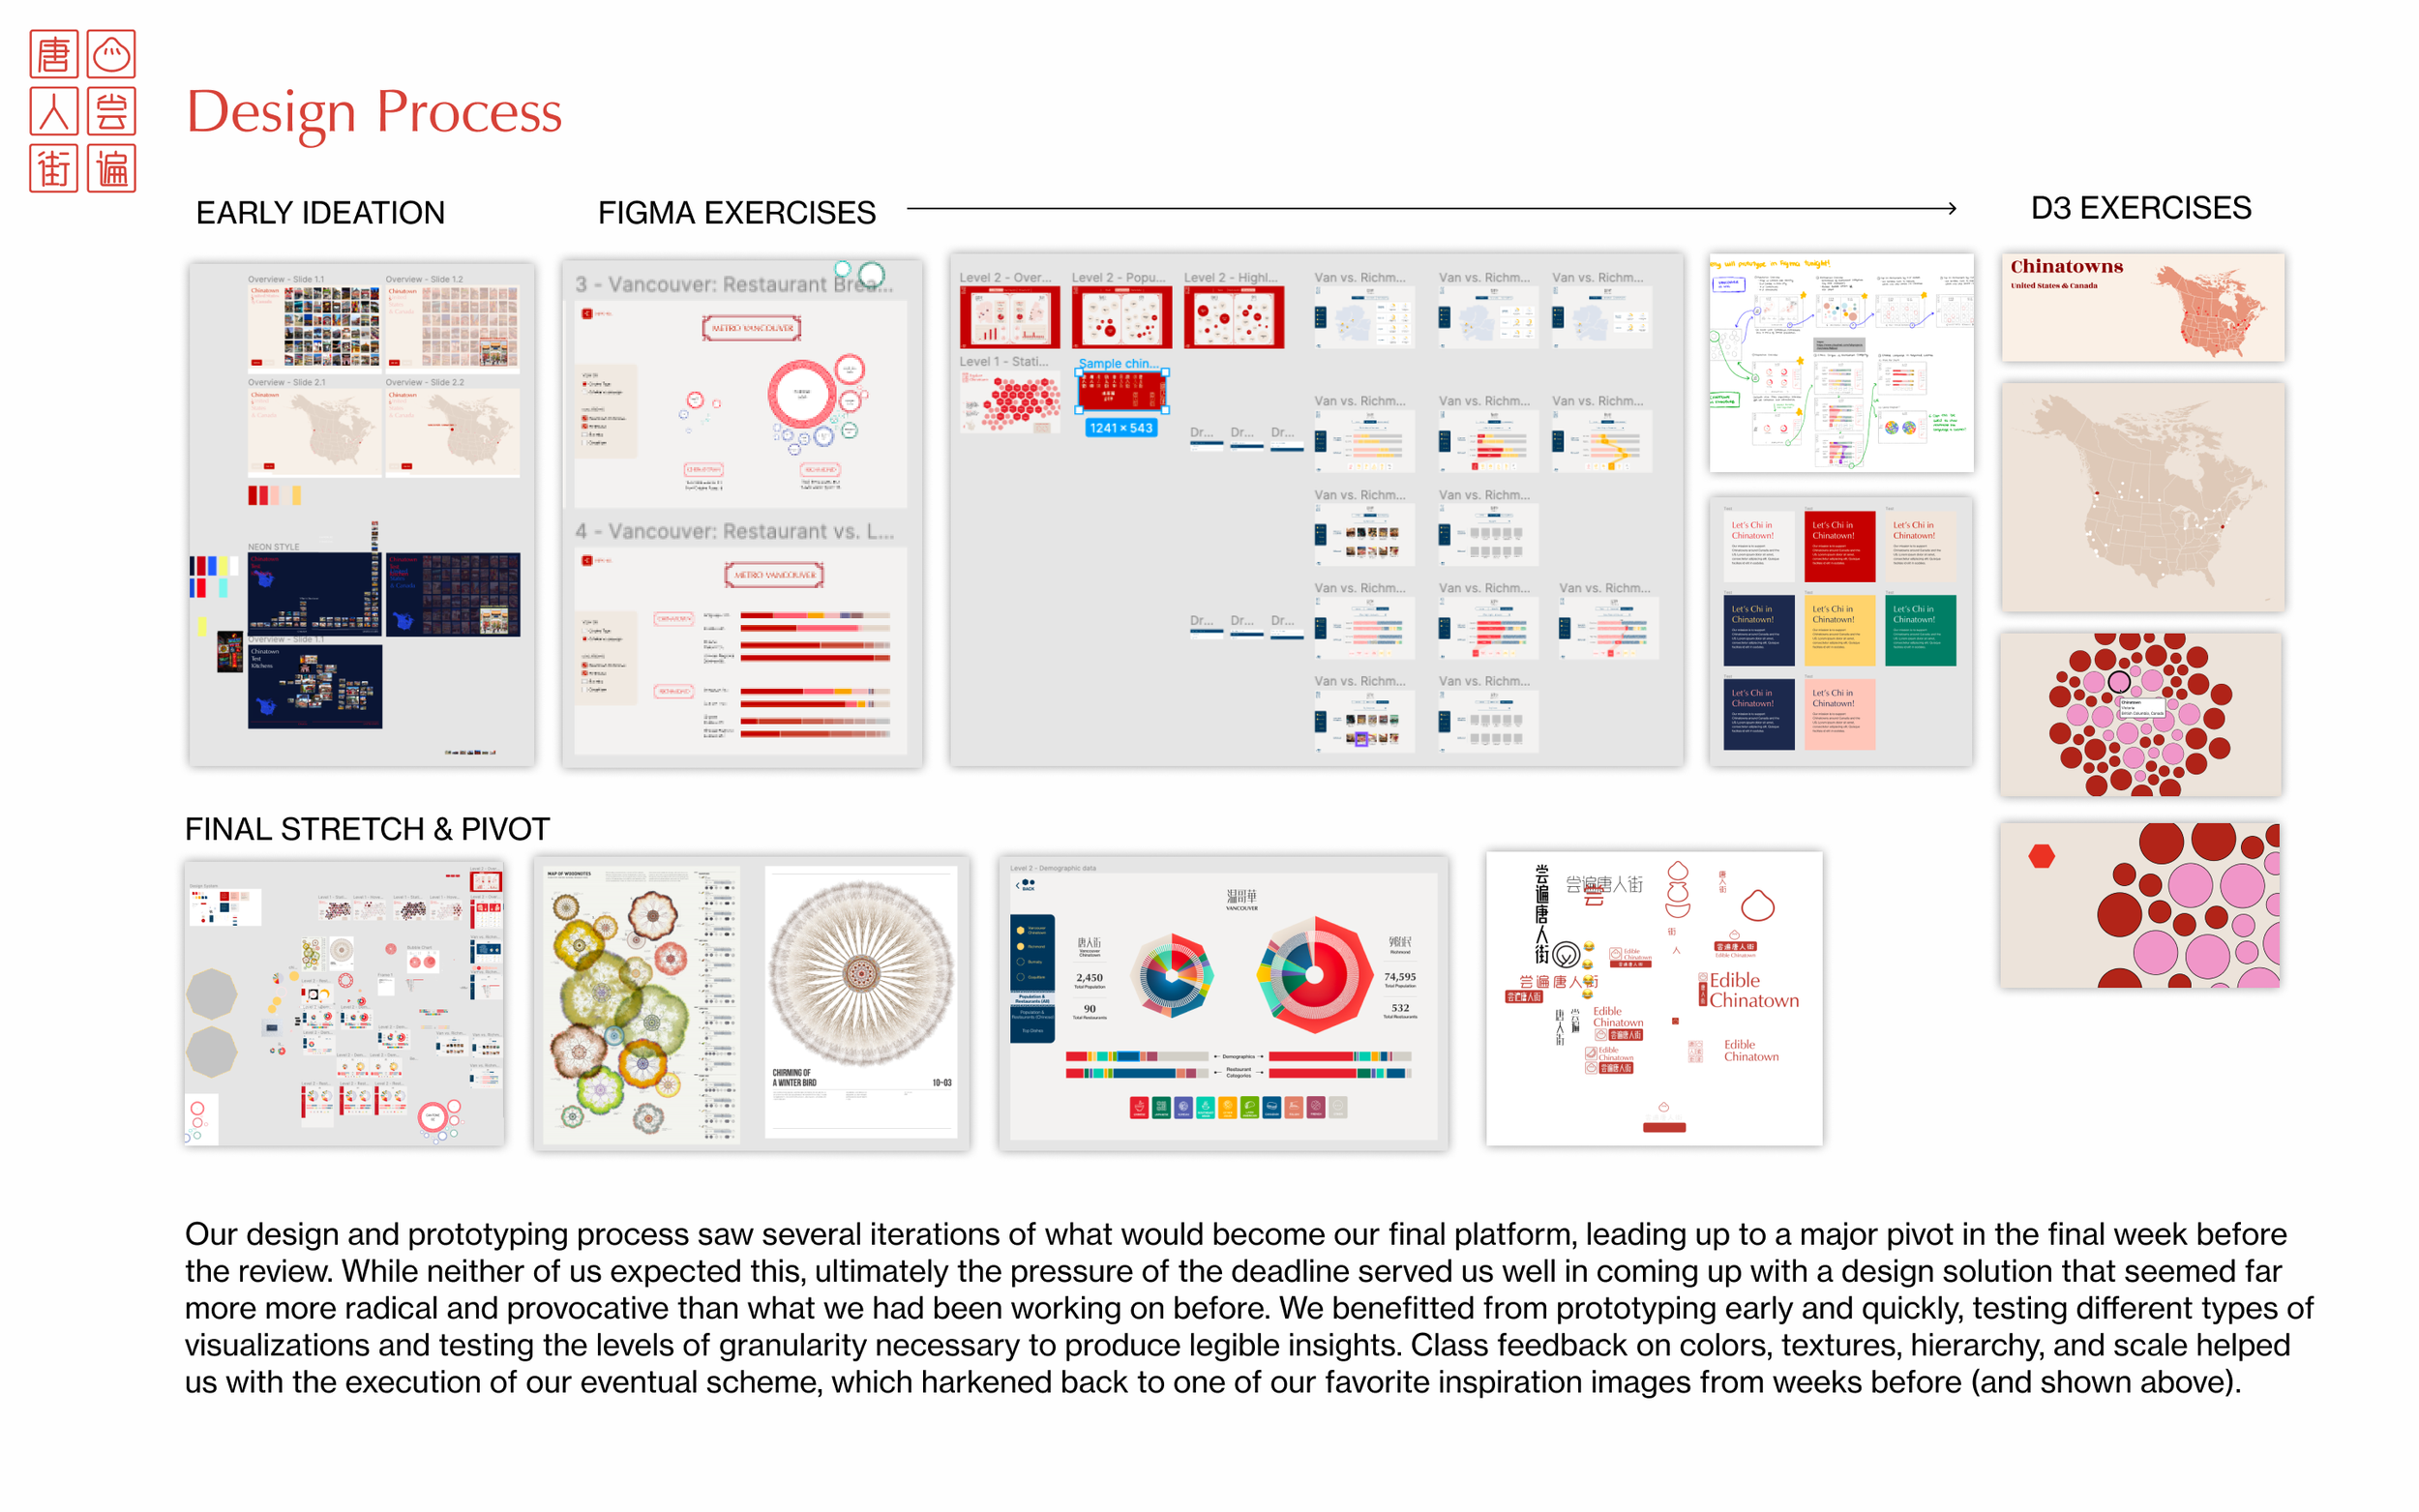

DESIGN PROCESS
Data collection & analysis
We used Yelp restaurant/menu data and census demographic data at the city and neighborhood level. Python allowed us to access the Yelp API and clean our results, followed by D3/JavaScript to collate and test visualization tactics. Microsoft Excel allowed us to compare census data and derive key relationships.
Prototyping
We iterated numerous approaches to our platform, ranging from a singular dashboard, to a scrollytelling format, to discrete pages. We utilizedquick sketches and wireframes before fleshing out the full platform in Figma, Illustrator, and AfterEffects.

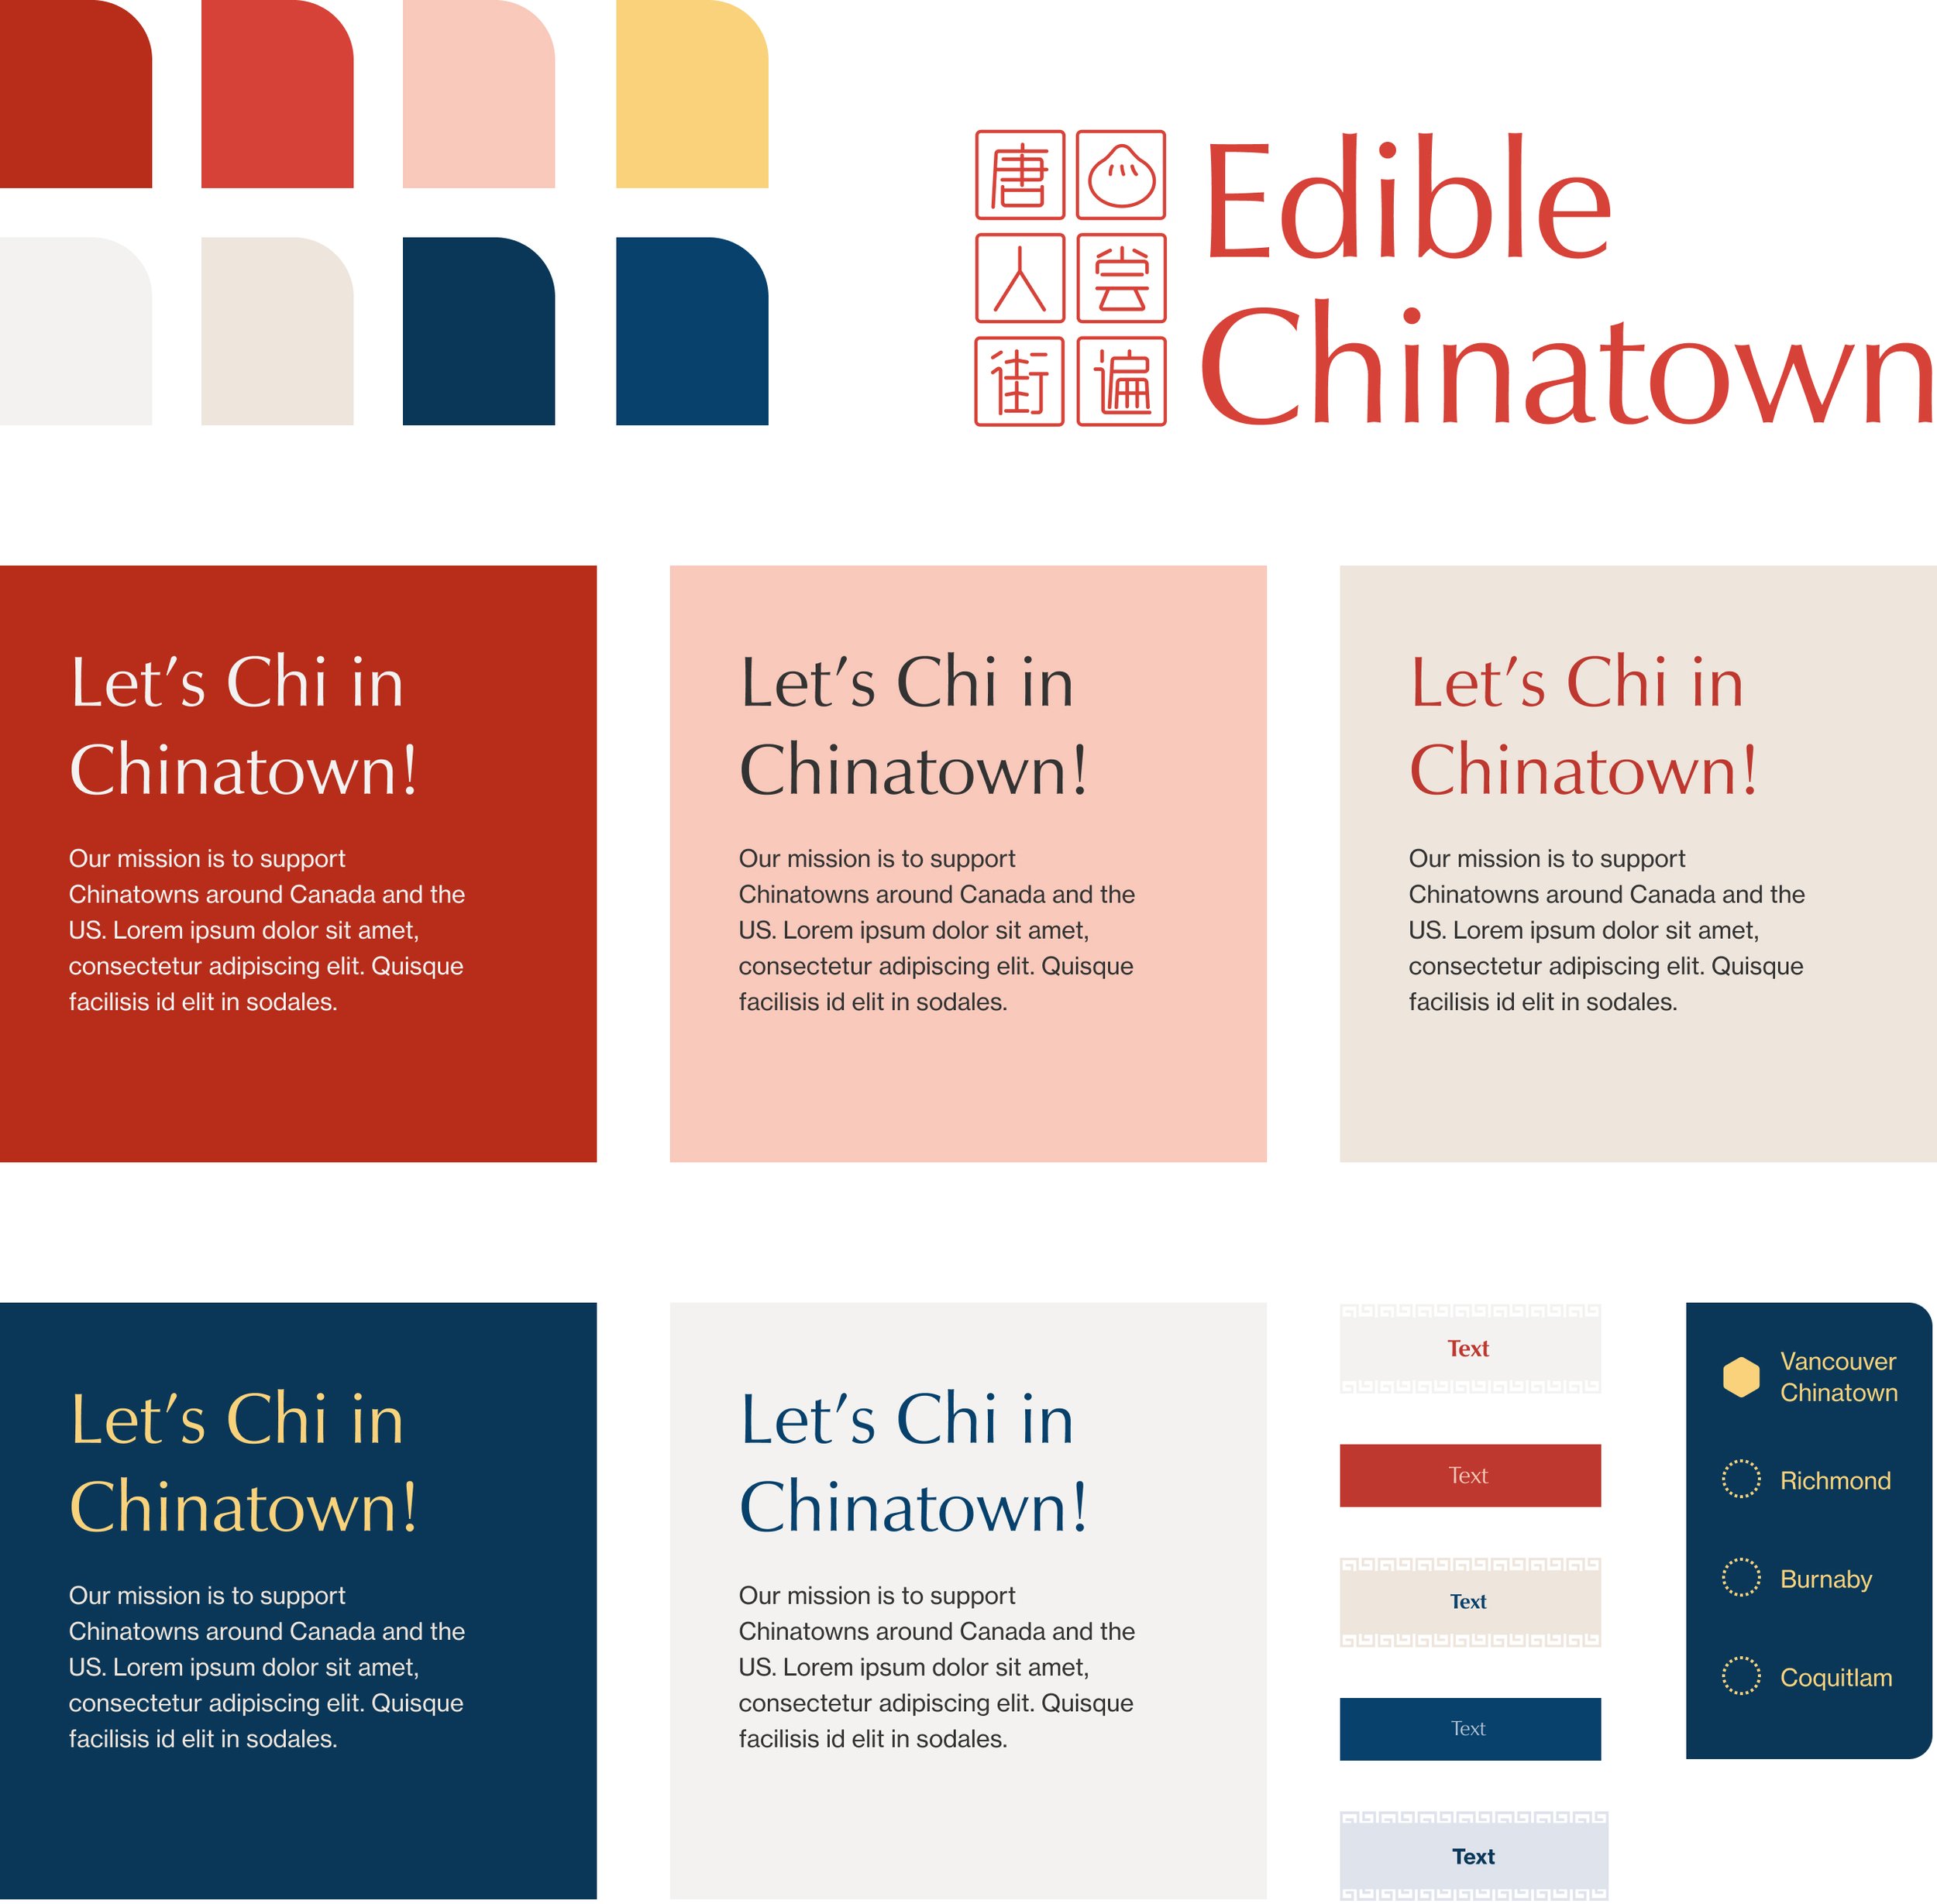
Visual Identity
We prioritized color, pattern, and texture to capture the diversity and vibrancy of these communities, inspiring play through digital interactions. We were influenced by the visual culture of Chinatown streets, hoping to bring modern flare to traditional color and typography choices.
THE LAYERS OF EDIBLE CHINATOWN:
-
Edible Chinatown opens on an abstracted map of all the Chinatowns (hexagons) and Chinese ethnoburbs (circles) across the two countries. The user can hover over a location to see all the Chinatowns and ethnoburbs in that metro area. They can also drag and drop specific locations they’d like to compare.
We picked two metro Vancouver neighbourhoods to demonstrate: Chinatown and Richmond. We selected these because Vancouver’s Chinatown is the largest in Canada, while Richmond is known as the “most Asian city outside Asia”. This dynamic offers rich input for visual exploration.
-
The outer ring and inner ring on the wheels correspond to the demographic and restaurant bars below, respectively. They are differentiated by slight patterns. As you hover each category tile, you can compare the proportion of the population against the proportion of restaurants under that category.
Here, you can see how Vancouver’s Chinatown has a surprisingly low proportion of Chinese people and restaurants. On the other hand, Richmond’s population and restaurant proportion is over 60% Chinese. Another interesting insight is that the population of Vancouver’s Chinatown is about 16% Canadian, but nearly half of their restaurants are Canadian. Based on this overview we can already see stark contrasts in both the demographics and restaurant compositions of the two locations.
-
You can also explore demographic and restaurant data by specific Chinese regions differentiated by patterns. The regional categories include Cantonese, Shanghainese, Fujianese/Taiwanese, and other Chinese which encompasses Sichuan, Beijing, Northern Chinese, etc. We also added “Chinese American” and “Asian Fusion” for restaurant data specifically.
You can see that in both Chinatown and Richmond, there is a decently-sized “Other-Chinese” population. However, in Chinatown, there aren’t any Chinese restaurants under the “Other Chinese” category - nearly all of them are Cantonese. Contrast that with Richmond - you can see that the majority of their restaurants are actually non-Cantonese. And this could be due to the fact that they are home to a more recent wave of Chinese immigrants that come from a variety of regions in China, whereas historically, immigrants to Chinatowns were primarily Cantonese. Finally, you can see how Vancouver’s Chinatown has a larger proportion of Chinese-American restaurants compared with Richmond, which is aligned with what we heard in our interviews.
-
The last level shows some of the most popular Chinese dishes in the most reviewed restaurants. The regional pattern markings are applied to each dish, while tooltips offer information on the dish’s history and availability.
In Chinatown, top dishes are mostly Cantonese and Asian Fusion offerings. While in Richmond, this sample shows a greater diversity of regional dishes. And as you can see, some dishes remain popular no matter the place as well. For example, Chop Suey is a classic Chinese American dish that has been subject to conflicting origin stories, becoming a historic poster child of conversations surrounding “authenticity” at the intersection of Chinese food and identity.
The ability to synthesize the origin of each dish with how many Chinatown or Richmond restaurants serve it, offers users both historic and localized context to their exploration of the platform at its various levels.

Edible Chinatown gave us two key insights: first, ethnoburbs provide a more holistic representation of regional Chinese foods and cultures. And though stagnant in growth, Chinatowns maintain a historically important role to their local contexts, acting as urban gateways to the Chinese diaspora.
We hope that the delivery of its content sparks dialogue beyond our collective notions of what Chinatowns were, are, and could be in relation to their surroundings.
IMPACT
Awarded distinction
SKILLS DEVELOPED
Web scraping
D3 & Node.js
Data processing
INSIGHTS
Data & data visualizations aren’t just a tool to communicate information for decision-making, they can also be used to tell tell stories about culture and history.